

Science teacher makes quick comment about significant figures and media reporting

(Thank you to @KelleyKga for a nice Twitter conversation about this phenomenon.)
You may have seen a swarm of headlines like this a couple of days ago.


Now that, which is the first “headline” I saw, is actually pretty good. She did actually say “estimates”, and even gave a link to the CDC page, which is better than what many other outlets did! But it still suffices for my illustration here. Let me make just a couple of comments.
One, to say “73%” by itself indicates a high degree of precision which is certainly unwarranted in this case. In science, if you say “73%” without any additional information, it will be assumed that, with a high degree of confidence, you know that the real number is between 72.5% and 73.5%. By contrast, if you were to say 70% instead, it would be assumed that, with a high degree of confidence, you know that the real number is between 65% and 75%, you are less certain. (If you said 73.7% the assumption would be, between 73.65% and 73.75%.)
But, you can provide additional explanation beyond the default assumption, and the CDC actually did. So, two, they actually stated the error bars on this number, and their 95% prediction interval went from… 34.0% to 94.9%.
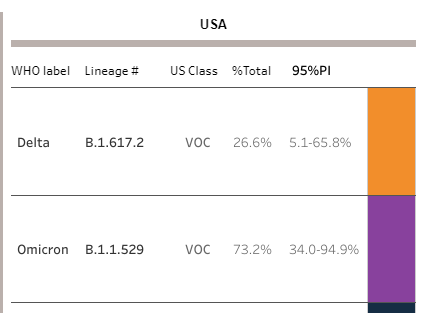
In other words, there was huge uncertainty in that 73% number, which the CDC did properly indicate on their website, but that uncertainty did not make it into most media headlines, and we know most people are not going to read past that headline.
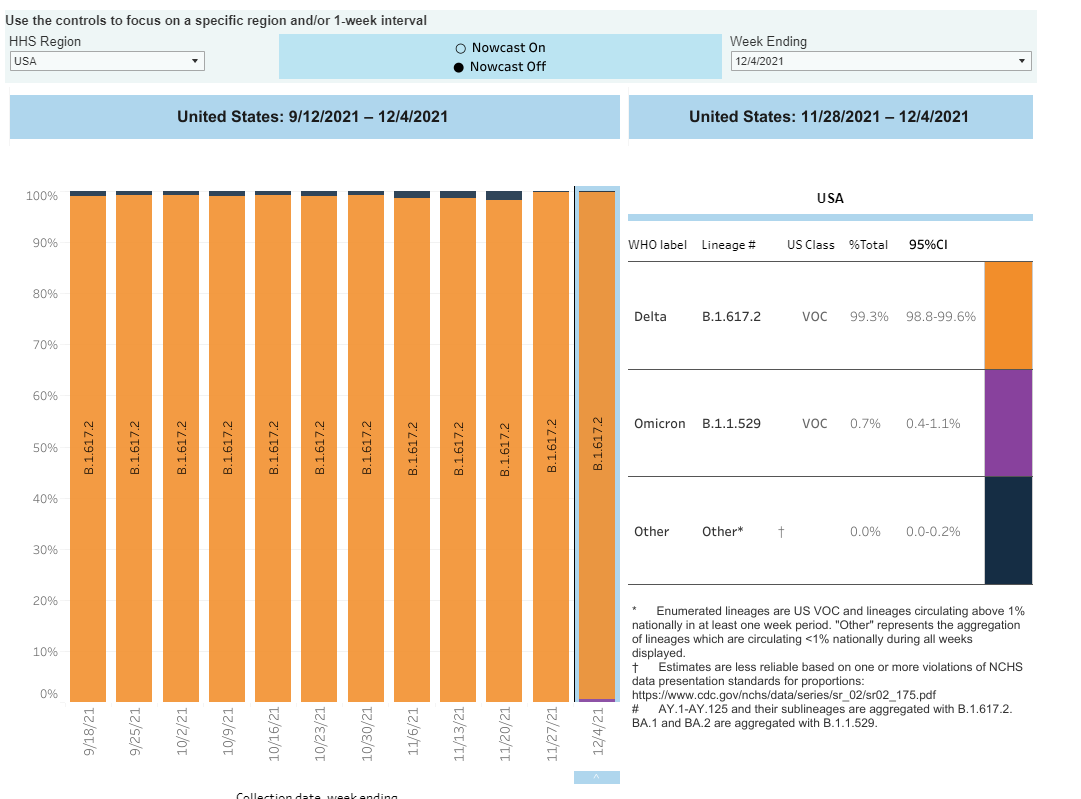
And then, three, the 73% number came from modeling, and we all know now that some (or a whole darn lot of) skepticism of models is always warranted. In fact if you turn the CDC “Nowcast” model off on their website, which you can do, the most recent data available is now the week ending December 4th (instead of December 18th), and Omicron made up 0.7% of actual checked tests. So that’s the end of the actual empirical data, two weeks in the past. (I’m not denying that Omicron is surely more prevalent now, I’m just pointing out what is actually happening here in terms of where these numbers are coming from.)
All that to say, a good headline might’ve been “According to CDC predictive modeling, Omicron now makes up 34% to 95% of COVID-19 cases in the United States”.
The paraphrased conversation in this article reinforces the posts here that say our ability to be swayed by fear and tribalism is much higher than thought possible, especially those of the highly educated zoom class.
https://brownstone.org/articles/the-reality-they-invent-to-feed-the-power-they-crave/
The irregular handling of statistics induces a state of conspiratorial cynicism about media coverage of any scientific question. Sometimes there will be 10 published papers containing observational studies, and the media line will be "wait on RCT data before we even start to pretend we know anything about this". Other times you'll see a single model being treated as though it was brought down the mountain by Moses.
The ambiguity of uncertainty in mean values has become a playground for confirmation bias and the crafting of opportunistic narratives.